


How crypto liquidations work, and how to read a liquidation map before the next cascade
October's long squeezes wiped out hundreds of millions in leveraged bets within hours. A guide to the mechanics behind liquidations and the data traders watch.
TRADINGANALYSIS
Daniel Hartley
10/27/20263 min read

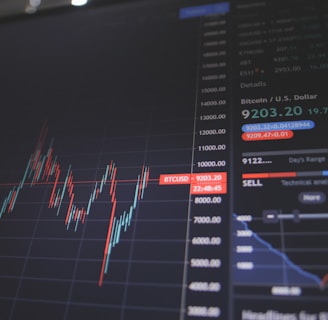
Around October 22 and 23, bitcoin dropped from close to $85,000 to below $81,000, and leveraged traders paid for it. CoinGlass counted roughly $431 million in liquidations over 24 hours, most of them long positions. Other trackers put the figure anywhere between about $412 million and $455 million, a spread that reflects how each provider covers a different set of exchanges. Three days later, as bitcoin slipped under $80,000, CoinGlass logged another $154 million, of which about $118 million came from longs. Liquidation headlines have become a daily feature of crypto news, yet the mechanism behind them is often misunderstood.
What a liquidation actually is
When a trader opens a leveraged position on a futures or perpetual swap market, they post collateral, called margin, that covers only part of the position's value. With 10x leverage, $1,000 of margin controls $10,000 of bitcoin. The exchange sets a maintenance margin, the minimum collateral that must remain in the account. If losses eat into the margin until it falls below that threshold, the exchange's risk engine closes the position automatically. That forced closure is a liquidation.
The arithmetic is unforgiving. As a rough rule, a position at 5x leverage gets liquidated after a move of about 20% against it, at 10x after about 10% and at 20x after about 5%, before fees and maintenance requirements bring those distances in further. On a day when bitcoin moves 4%, which is unremarkable for this market, traders running high leverage can be wiped out entirely.
Exchanges trigger liquidations based on a mark price, usually derived from an index of several spot venues, rather than the last traded price on their own book. That design protects traders from a single bad print, but it also means a broad move across exchanges hits everyone at roughly the same moment.
Why liquidations cascade
A liquidation is a market order. When a long position is closed by force, the exchange sells into the order book. If many positions share similar liquidation prices, those sales push the price lower, which triggers the next layer of liquidations, and so on. This feedback loop explains why a modest dip can turn into a sharp wick within minutes, and why prices often snap back once the forced selling is exhausted.
Leverage tends to accumulate in predictable places. Traders cluster stop-losses and entries around round numbers, recent highs and lows, and widely watched cost-basis levels. In its October 21 report, Glassnode identified large liquidation clusters above the market near $85,000 and $87,000 and a notable band below near $79,600. Those zones work like fuel. A push into them can accelerate a move, and once they are cleared the market often loses momentum.
How to read a liquidation map
Liquidation heatmaps, published by data providers such as CoinGlass and others, estimate where open positions would be forced out, based on open interest, typical leverage levels and entry prices. Brighter bands mean more estimated liquidations at that price. They are estimates, not order books: exchanges do not publish every trader's liquidation price, so the maps rely on models.
Read them alongside two other figures. Open interest shows how much leverage is in the system in total. Glassnode noted that open interest stood only about 5% below its October peak on a constant-price basis, which means most leveraged positions survived the recent shakeouts. Funding rates show which side is paying to hold its position. When funding is strongly positive, longs are crowded and more exposed to a cascade. On altcoins, Glassnode found that fewer than 5% were paying above-neutral funding by October 20, down from nearly a quarter in late September, which suggests long leverage there has cooled considerably.
If the market moves so fast that a position cannot be closed before its margin is exhausted, the loss goes beyond the trader's collateral. Exchanges cover these gaps with an insurance fund. When that fund is not enough, many venues use auto-deleveraging, which forcibly reduces the positions of profitable traders on the other side. Auto-deleveraging is rare, but it shows that liquidation risk does not end with the trader who took the leverage.
What traders take from this
The practical lessons are mechanical rather than predictive. Leverage determines how much room a position has before the exchange closes it, and that room shrinks quickly in a market where daily swings of 3% to 5% are common. Isolated margin limits a liquidation to one position, while cross margin puts the whole account at risk. And a planned exit is generally cheaper than a forced one, because liquidation fees and slippage in a cascade are rarely kind. Liquidation data does not tell anyone where the price is going, but it shows where the market is most fragile, and that is often the more useful information.